To keep track of your server’s health, it’s essential to have a monitoring solution. This guide uses Prometheus, Grafana, and Node Exporter – three open-source tools that together form a powerful monitoring stack.
Node Exporter is a lightweight exporter that collects hardware and OS metrics from your server (like CPU, memory, and disk usage) and makes them available to Prometheus.
Prometheus is a monitoring tool designed to collect, store, and query time-series data. It scrapes metrics from monitored systems and can alert you if certain conditions are met. For our purpose, we’ll scrape the metrics exposed by Node Exporter.
Grafana visualizes data from Prometheus, displaying metrics in dashboards that make it easier to understand trends and anomalies over time.
With these tools, you’ll be able to view server metrics in a Grafana dashboard and get insights into system performance, helping you detect issues before they become critical. This tutorial will walk you through the setup process.
Prerequisites
First, make sure you have docker installed, including docker-compose. If not, you can follow the instructions here. Portainer is useful if you plan to use it for managing Docker, but isn’t required.
Install
Create a folder that you are going to use for this docker compose stack. Mine is in ~/docker/monitoring.
Create a docker-compose.yml file inside the folder with the following contents:
services:
  prometheus:
    image: prom/prometheus:v2.54.1
    container_name: prometheus
    volumes:
      - ./prometheus:/etc/prometheus
      - prometheus-storage:/prometheus
    command:
      - '--web.enable-lifecycle'
      - '--config.file=/etc/prometheus/prometheus.yml'
    ports:
      - 9090:9090
    networks:
      - monitoring
    restart: unless-stopped

  grafana:
    image: grafana/grafana:11.2.2
    container_name: grafana
    ports:
      - 3000:3000
    volumes:
      - grafana-storage:/var/lib/grafana
    networks:
      - monitoring
    restart: unless-stopped

  node-exporter:
    image: prom/node-exporter:v1.8.2
    container_name: node-exporter
    volumes:
      - /:/host:ro,rslave
    command:
      - '--path.rootfs=/host'
    ports:
      - 9100:9100
    networks:
      - monitoring
    restart: unless-stopped

volumes:
  grafana-storage: {}
  prometheus-storage: {}

networks:
  monitoring: {}
Create a prometheus subfolder and inside it create a prometheus.yml file with the contents below. This is the config file in which we define the endpoints that Prometheus should scrape:
global:
  scrape_interval: 15s  # Scrape every 15 seconds

scrape_configs:
  - job_name: 'prometheus'
    static_configs:
      - targets: ['localhost:9090']

  - job_name: 'node-exporter'
    static_configs:
      - targets: ['node-exporter:9100']
From the folder containing the docker-compose.yml file, run:
$ docker compose up -d
If all goes well, you’ll be able to access the following URLs:
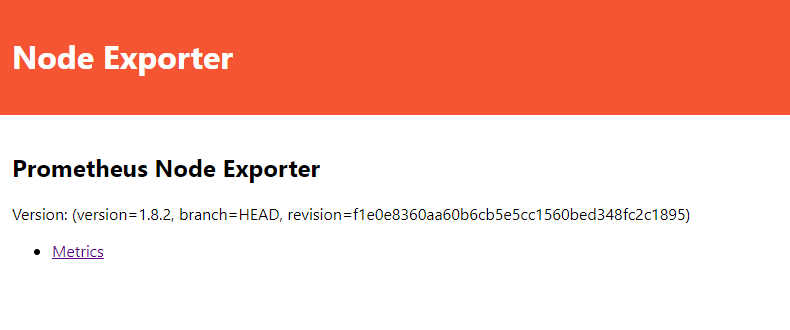
http://<hostname/ip>:9100/ (http://localhost:9100/ if running on the local machine) – shows the Node Exporter UI, something like this:
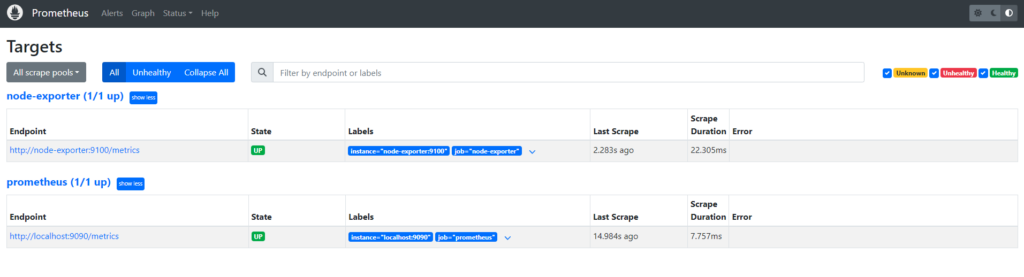
http://<hostname/ip>:9090/ (http://localhost:9090/ if running on the local machine) – shows the Prometheus we UI; if you navigate to ‘Status’ – ‘Targets’, you should see 2 healthy targets:
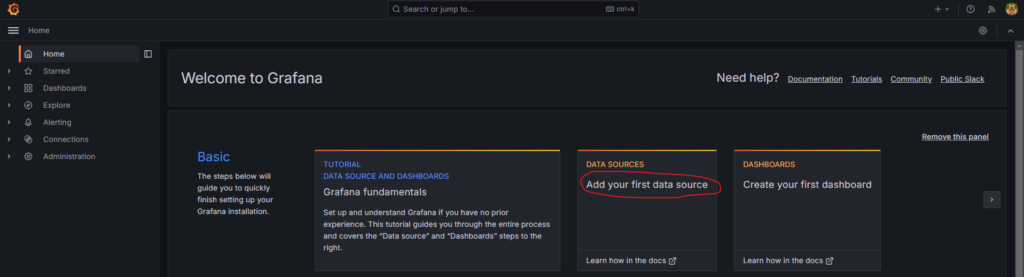
http://<hostname/ip>:3000/ (http://localhost:3000/ if running on the local machine) – shows the Grafana UI:

The default login for Grafana is admin/admin. You will be asked to change it after login.
Create dashboard
Now let’s create a dashboard to visualize all the metrics that Prometheus is gathering from Node Exporter.
From the home page, click Add your first data source:
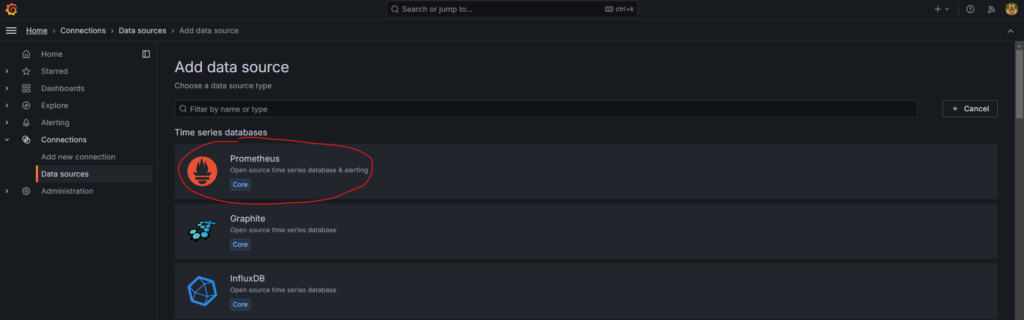
Choose Prometheus from the list:
For the Prometheus URL, enter http://prometheus:9090 :
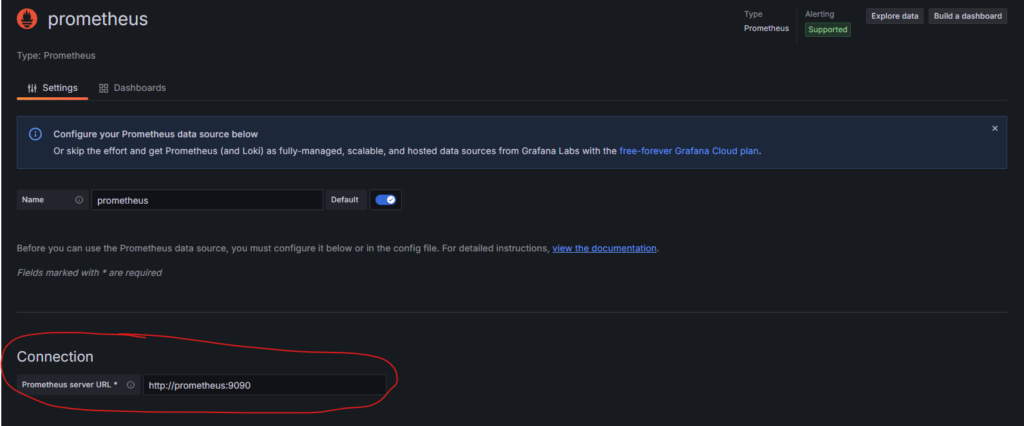
Scroll to the bottom and click Save & test.
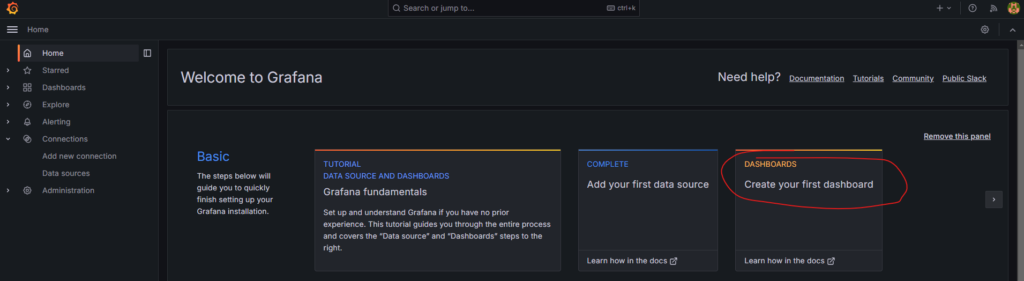
Go back to the home page and click Create your first dashboard:
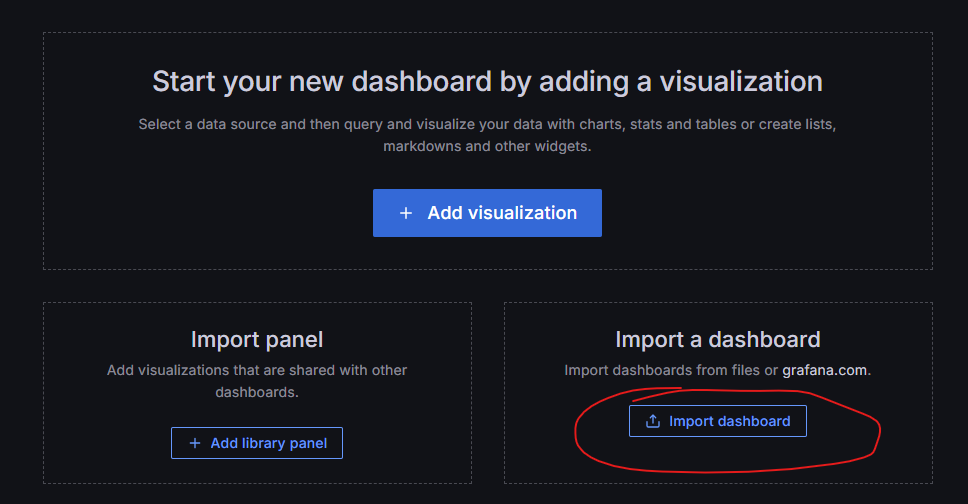
Click Import dashboard:
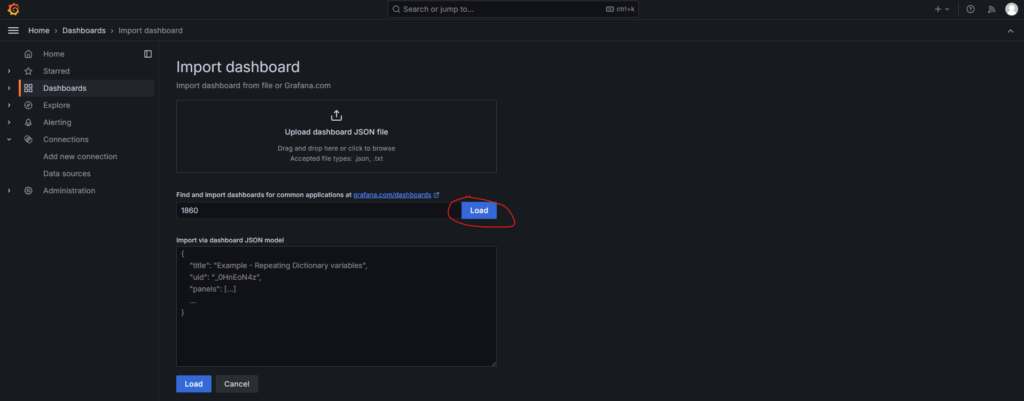
Enter 1860 for the dashboard ID and click Load:
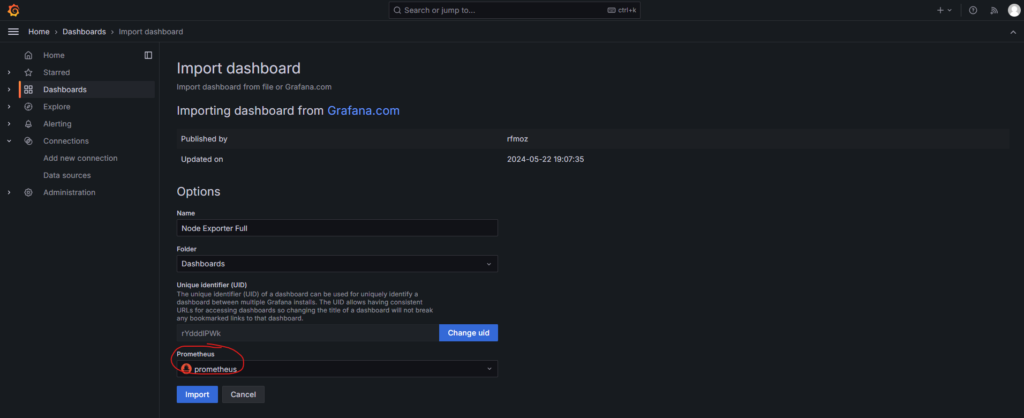
On the next page, choose the Prometheus data source and click Import:
You will then be directed to your dashboard, where you can visualize various information about the machine where you installed:

Hope this helps, have fun clickity-clacking.
Leave a Reply